GATE CSE 2020 Q10: Aggregate profit or loss from a revenue bar graph
- General Aptitude
- 2 marks
- MCQ
- −2/3 if wrong
Question
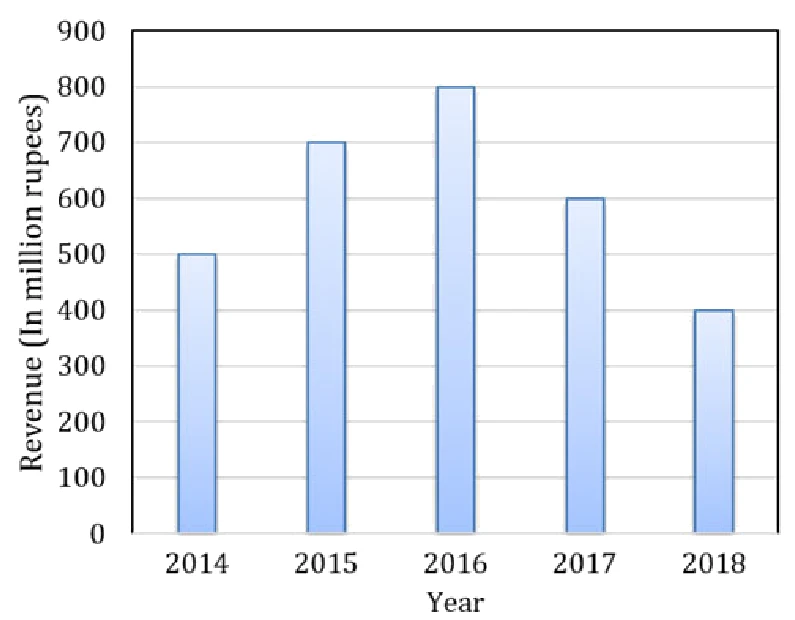
The total revenue of a company during 2014-2018 is shown in the bar graph. If the total expenditure of the company in each year is 500 million rupees, then the aggregate profit or loss (in percentage) on the total expenditure of the company during 2014-2018 is ____.
Try it: multiple choice: exactly one correct option
Show answer and explanation
Answer: C (official GATE 2020 final answer key)
Concept used: Percentage profit = (total revenue − total expenditure) / total expenditure × 100.
First step: Total revenue is 500 + 700 + 800 + 600 + 400 = 3000; total expenditure is 5 × 500 = 2500.
Full step-by-step solution
Detailed working, common mistakes and linked mock tests will be available with a free GATEiit account. Log-in is coming soon.
Share this question
Source: official GATE 2020 CS question paper and final answer key, organised by IIT Delhi. Question paper · Answer key
More General Aptitude PYQs
- 2026 Session 1 · Q1Antonym of protagonist
- 2026 Session 1 · Q2Which grid cannot be tiled by a 2×2 square and a 1×4 bar
- 2026 Session 1 · Q3Games needed in a 64-player knock-out tournament
- 2026 Session 1 · Q4Maximum elective credits under credit constraints
- 2026 Session 1 · Q5Statement not implied by 'teacher in room ⇒ students stand silently'
- 2026 Session 1 · Q6Inference from a passage on combinatorics in physical models